
Artificial intelligence investing bot
What is RM Investing AI?
RM investing AI is a fully automatized program that makes daily predictions of 2247 companies using six independent algorism including self-created and ML algorisms to detect the best investing opportunities.
Overview:
Developed since the summer of 2021, I created this program as a final degree project and I continued developing it as a passion. The code has evolved over the time adding more risk factors to improve the predictions, and doing long periods of testing. To improve the code, I read lots of financial reports, investing books, and CFA books. Those books help me to understand more about the stock market and give me an extended knowledge about how the markets work and how to identify and prevent the highest risks. Also, the huge amount of hours of coding, made me be able to create my own algorithm to solve the complex problems I had to face and also be able to automatize all the process making the program the most technical possible. Achieving my main objective to create a program that is profitable and 100% automatic. Another important part of this program comes from the persons that helped me to create the project including persons with Computer and Data Science background to bankers and hedge funds, all these persons inspired me and give me a new point of view. All these things made me go passionate about this program and became a complex and advanced program.

How it works ?
With more than 2200 stocks this program analyse the biggest companies of different regions of the word, through artificial intelligence. This program use six independent algorisms to analyse the current situation of a company, by studying the stock price, financial states, the current news of the company and more risk factors. The results of this algorithms are going to be a theoretical value of how likely the stock analysed will achieve a significant return, based on the historical data. To select the companies to invest in, the program will define if the theoretical value of algorisms will maximizes the investment return or not, by giving a value 1 to the algorisms that will maximize the return and 0 to the others. The companies that have 4 or more algorisms that maximizes return or good algorism and pass the three last checks are selected as good opportunities to invest in.
This program is executed in my personal server, and it is completely automatized. During the weekdays the program is executed for the 2247 companies, and it takes 23 hours to analyse all to them and in the weekend creates a public weekly report to know how the program is going. In addition, the program is integrated to IB API so even the investment is automatized.
Discover the six algorithms:
The six algorithms are based in supervised algorism, these models use labled data to train the model and make predictions with the new data. To train the data its necessary a target variable, to study the impact of the independent variables. The target variable for all the algorisms is the return of the investment in two weeks. So, the algorisms will determinate with independent variables the stocks that are more likely maximize the average return of our target variable. As the program contemplate a period of two weeks, anything outside the two weeks period is unknown by the program, so the program is created to do two weeks investment.

Technical analysis:
This ML algorism analyse the impact of the price deviation over different periods of time, the local maxim and minim and the prices deviation compared to the S&P500.

Financial ratios:
This algorism obtains 17 ratios, grouped in: Stock price, Liquidity, Profitability and Leverage. Then, score the ratios to obtain a global image of the financial situation of the company.

Financial Statements 1:
Apply the self-created RM algorism using the data of the quarter deviation of 27 financial metrics. This algorism find correlation between metrics deviation and a higher investment return.

Financial Statements 2:
This algorism also uses the data of the quarter deviation of 27 different financial statements, however apply the Binary Logistic Regression algorism to detect correlations.

News:
This algorism obtains and split the words of 250k news and analyze the correlation between words and return. In order to detect and prevent unexpected events that can affect the company.

Financial Growth:
Through the RM method, this algorism is going to study the growth of a company by studding 38 metrics and detecting the companies that will maximize the return of the investment.
Results:
After more than six-month executing the program and obtaining more than 150k results of the predictions there is a clear correlation between the companies selected by the program and a higher average return.
During this period the program selected a total of 2488 companies, where 1803 of them obtained positive returns which means a significant of profitable investments. On average the companies selected obtained a 1,47% return in just two weeks of investment. The positive performance of the program is constant throughout the period studied, even if it suffers some decrease with unexpected events such as the Silicon Valley bank crisis, the overall performance is positive. Also, if we compare the average return of the program and the famous index S&P500 or the set companies analysed the results obtained are significantly better

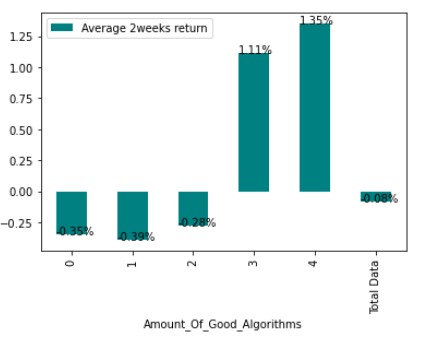
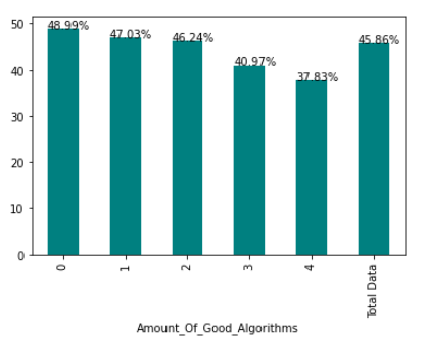
Analyzing the results in detail, we can see how the results of the six independent algorithms affect the risk and the investment return, so as the higher the number of good algorithms higher the return. In the next graph we can se a clear distribution of how an additional positive result in the number algorithms reduces the risk and increase return, for this reason we can see how the results in the different algorism have a significant and real impact in the investments.
Also, If we take a look to the performance during the first 6 months of the companies selected and the index S&P500 we can see that the results are consistent better during the time. Considering that the sample is big enough (150k results) and the period analyzed is not short I can affirm that the program reduces the risk significantly and obtain higher results than the market. In addition, every Saturday the code creates a weekly report with the results of the last week. These results show the average return of the companies selected, the average return of the S&P500 index, the average return of all the companies studied and the historic return of all the companies selected.
Documentation
During the development of the program, I had to document the program either for the final degree project or to explain it to colleagues or friends. In the first version of the program (final degree project), there were only two types of algorithms, while in the explanation of how it works, the six algorithms that are currently used are explained in detail. Next, you can take a look at the extended document of the final degree or the explanation of how the six algorithms work.

Research paper

How it works